This is an archive of the old Stones Cry Out site. For the current site, click here.
« Immigration Debate Continues | Main | Terri Schiavo Audio? »
March 20, 2005
Critique of Simon/Baiman Exit Poll Paper
I'm reviving two posts from the old SCO related to my work on exit polls. I wrote this post in response to a paper by Jonathan D. Simon, J.D., and Ron P. Baiman, Ph.D., with the title, "The 2004 Presidential Election: Who Won The Popular Vote? An Examination of the Comparative Validity of Exit Poll and Vote Count Data." Apparently in response to my post, the authors revised their paper and therefore this post was my response to their revisions. The full text of my posts are included below the fold.
POST I: Simon and Baiman on Exit Polls
Freepress.org recently published a paper by Jonathan D. Simon, J.D., and Ron P. Baiman, Ph.D., with the title, "The 2004 Presidential Election: Who Won The Popular Vote? An Examination of the Comparative Validity of Exit Poll and Vote Count Data."
Mr. Simon is with Verified Vote 2004 (couldn't find the organization on the web) and Dr. Baiman is affiliated with the Institute of Government and Public Affairs University of Illinois at Chicago, although the paper includes a disclaimer that the views expressed therein are not necessarily the views of their respective institutions.
The paper concluded with the following statement:
In light of the history of exit polling and the particular care that was taken to achieve an unprecedented degree of accuracy in the exit polls for Election 2004, there is little to suggest significant flaws in the design or administration of the official exit polls. Until supportive evidence can be presented for any hypothesis to the contrary, it must be concluded that the exit polls, including the national mega-sample within its +/-1.1% margin of error, present us with an accurate measure of the intent of the voters in the presidnetial election of 2004.According to this measure, an honest and fair voting process would have been more likely than not -at least 95% likely, in fact- to have determined John Kerry to be the national popular vote winner of Election 2004. Should ongoing or new investigations continue to produce evidence that, to an extent determinative of the electoral college outcome, votes have not been counted acurately and honestly or discriminatory cote suppression has occurred, the re-examined popular vote outcome may well be deemed relevant to the question of what remedies are warranted (Simon and Baimon, 2004, p12).
My critique of the Simon/Baiman paper focuses on the narrow questions of methodology and statistical analysis. The author's claims and hypotheses, which are based on the statistical analysis are not evaluated.
The Introduction
The authors acknowledge that the popular vote isn't important in deciding an election, yet posit that the "apparent" 3.3 million vote Bush popular victory makes it very hard for Kerry to challenge the results in an individual state where the electoral count could be affected.
Yet to overturn the Ohio result, giving Kerry an electoral college victory..., would likely be regarded as unjust and insupportable by a populace convinced that Bush was, by some 3.3 million votes, the people's choice (Simon and Baimon, 2004, p3).Therefore, if Simon and Baiman can demonstrate that "an honest and fair voting process" would have determined "John Kerry to be the national popular vote winner of Election 2004" then their findings are important for the future of America.
Review of Exit Polls and Vote Counts
The opening paragraph of Simon and Baiman's review of the exit polls and vote counts constructs a three-legged strawman. The first leg is fabricated from the following statement,
Exit polling, since its invention several decades ago, has performed reliably in the projection of thousands of races, both here at home and, more recently, abroad (Simon and Baimon, 2004, p4).This statement includes a footnote directing readers to a chapter written by Warren Mitofsky in the book "Polling and Presidential Election Coverage " in 1991. Usually, if a statement in a paper, article, or book is followed by a footnote directing readers to a source, that source supports the statement. However, the Mitofsky chapter nearly the opposite of what is suggested by the authors.
Exit polls were “invented” in 1964 by a woman named Ruth Clark when polling the presidential primary (Mitofsky, 1991, p88). Mitofsky describes in his chapter how exit polls were used extensively from 1970 to 1980 by CBS for background, but not for projections at all until 1982.
It was not until 1982 that CBS News used exit polls for projections (Ibid)Also, NBC didn't conduct exit polls until 1980 and even then didn’t use them for projections until 1982 (Ibid). Finally, the chapter makes no mention of foreign exit polls that I can find. If Simon or Baiman would have read their citation, they would not have made that statement; unless they were, of course, building a strawman.
The second leg of the strawman is built with the two sentences that followed the sentence forming the first leg:
The record of exit polling from the 1970s through the 1990s was essentially free of controversy, except for the complaint that publication of exit poll results prior to poll closings dampened voter turnout by discouraging late-in-day voters from bothering to vote, the race having already been “called.” Voters could be so influenced because they had come, indeed, to regard exit poll projections as all but infallible.”While it is true that the controversy surrounding the exit polls, beginning in 1980, was largely about whether or not use of these polls by the media to project winners before polls closed had the effect of discouraging late-in-day voters, they fail to consider that the before poll closing exit polls had a record of being terribly wrong (1984, 1988, and 1992 elections).
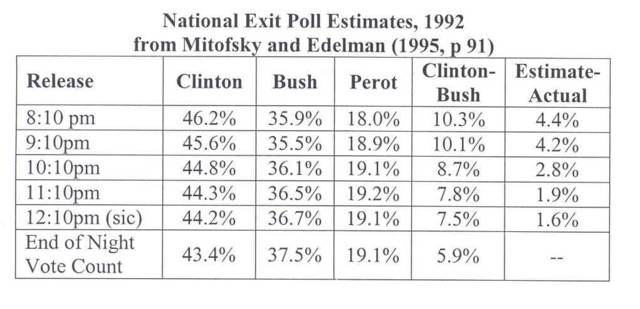
Warren Mitofsky and Murray Edelman analyzed the 1992 presidential election exit polls and wrote the following:
As the evening went on, the national exit poll gradually was completed. The results shown in Table 6.3 for midnight were the only results that included the completed exit polls. All estimates at earlier times were incomplete…The difference between that final margin and the VRS estimates was 1.6 percentage points. VRS consistently overstated Clinton’s lead all evening…Overstating the Democratic candidate was a problem that existed in the last two presidential elections (Mitofsky and Edelman, 1995, pp91-92).The Table 6.3 referenced above is summarized below as Exhibit 1. From this table, you can see that as of the 8:10pm round of exit poll data, the poll data included Clinton bias by 4.4%. This bias narrowed as the evening progressed, with the last round of data circulated just after midnight on election eve showing Clinton bias of 1.6%.
Based on a review of the literature for exit polls conducted through 1992, exit polls were first used to project elections in 1982 and the exit polling results were skewed toward the Democratic candidate for the 1984, 1988, and 1992 elections. (Mystery Pollster recently posted on the accuracy (i.e., relative inaccuracy) of post-1990 exit polls.) Therefore, while it may be true, as suggested by Simon and Baiman that "Voters could be so influenced because they had come, indeed, to regard exit poll projections as all but infallible," it cannot be concluded that the exit polls were indeed infallible.
The final leg of the Simon/Baiman strawman is constructed with the following unsourced statement:
Significant exit polling problems began to appear along with the development and spread of computerized vote counting equipment, since which time exit polls have had a notably poorer track record in spite of improvements in polling methodology.Again, this statement is unsourced and the authors do not define what "problems" they are referring to. Clearly, Mitofsky and Edelman, believed there were problems with the exit polls in 1984, 1988, and 1992 (Mitofsky and Edelman, 1995, pp91-92). And, exit polls weren't used for projections until 1982, so I'm not sure where the authors find support for their statement.
The remaining paragraphs of the section of the Simon/Baiman paper that review exit polls and vote counts offer an overview of Warren Mitofsky's experience and credentials and deals at length with the various methods of tallying votes on election day. I didn't bother to trace the sources and claims about the tallies and methods. As explained later in this post, the statistical analysis employed by Simon and Baiman assumes an accurate vote tally.
The Data
Simon saved screenshots of the CNN web-site in the early morning hours of November 3rd, 2004. The national exit poll data that serves as the basis of the Simon/Baiman paper was pulled at 12:23 am. The CNN web-site reported the proportion of the vote by candidate by gender. The authors somehow divined overall proportions significant to a 10th from an extrapolation of whole numbers. Nevertheless, the Simon/Baiman paper determines that the final "uncalibrated" exit poll (not weighted to the election result), showed Bush with 48.2% and Kerry with 50.8%.
Recently, I stumbled across this site, which appears to have the PDFs for some of the regional and national exit poll releases. On election day, data was circulated in rounds throughout the day. The data linked to above appears to only include the 3:59pm and 7:33pm rounds. A sample of the PDF for the 7:33pm release of the national exit poll is presented in Exhibit 2.
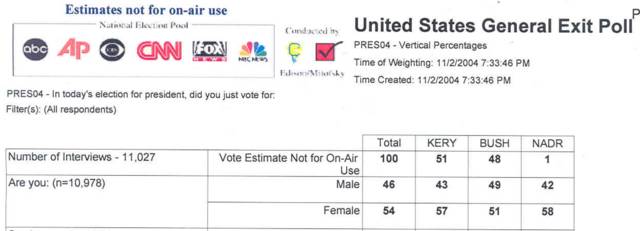
As shown in the exhibit, the 7:33pm release showed Kerry up nationally 51% to 48%. Incidentally, this appears to be unchanged from the 3:59pm release, which was based on fewer interviews than the 7:33pm release.
The Simon/Baiman data included a sample size of 13,047 (by gender), whereas the 7:33pm data is based on a sample size of 10,978 (by gender), therefore we can assume the data posted on the CNN web-site at 12:23am was derived from a later release from the NEP than that shown in Exhibit 1. However, Richard Morin of the Washington Post confirmed that the final release of the national exit poll data reported Kerry with 51% and Bush with 48% of the popular vote. Of these final data, Richard Morin wrote:
The 51-48 K were reported as whole numbers, the marginal estimates atop a set of static tables that broke down the results by various demographic and political groups (Morin, 2004).The data circulated on election eve were reported as whole proportions. The Simon/Baiman paper is based on analysis of data extrapolated to a 10th and is therefore not technically "accurate." Although the authors' use of 48.2% (Bush) and 50.8% (Kerry) understates the significance of the observed discrepancy with the election tally, as explained later in this post, the lack of a significant digit associated with the exit poll data has implications for the conclusions reached in their paper.
The Anaysis
Simon and Baiman determine that the margin of error associated with the national exit poll data based on a sample size of 13,047 is +/- 1.1% (Simon and Baiman, 2004, p9). To get this figure, they take the standard error of a simple random sample and multiply by a factor of 1.3 to account for clustering (exit polls are necessarily cluster samples, not simple random samples).
The 1.3 factor was applied because this was determined by Merkle and Edelman (2002) to be the difference between the standard error of the 1996 presidential election exit polls and the standard error of a poll based on a simple random sample of the same size. This factor is also known as the design effect square root.
Warren Mitofsky has indicated that the factor calculated for the 2004 exit polls ranged from 1.5 to 1.8 depending on the average number of samples per precinct(Mitofsky, 2004):
The Merkle/Edelman paper is not what we computed this year...both Merkle and Edelman participated in this latest calculation (Ibid).Dan Merkle of ABC News wrote the following regarding the use of this factor for analysis of the 2004 Presidential Election exit polls:
What was in the Merkle and Edelman chapter is only a general estimate based on work at VNS in the early 1990s. The design effect will vary state by state based on the number of interviews per precinct and how clustered the variable is. More work was done on this in 2004 by Edison/Mitofsky. Edelman and I did participate in this. I would suggest using the design effects calculated by Edison/Mitofsky for their 2004 polls (Merkle, 2004).Complicating the computation of the design effect square root is that there are likely two different factors used for the intercept interviews and the telephone interviews:
[Mitofsky's design effect square roots] only appl[y] to the intercept interviews. [T]here may be a separate (smaller) design effect for the telephone survey component (Merkle, 2004a).I checked with Jennifer Agiesta of Edison Media Research whether there was a smaller design effect associated with the telephone survey component than reported by Mitofsky. Ms. Agiesta replied:
According to Warren, we did a new study since the one that Dan Merkle and Murray Edelman did some years ago and the design effects Warren reported to you were the latest ones computed. The whole advisory council, including Dan Merkle and Murray Edelman, participated in it and agreed that the information on design effects that Warren sent you is correct (Agiesta 2004).Although I'm not certain that Ms. Agiesta understood my question and I have a follow-up question pending with her, it should be clear that use of the 1.3 factor is "technically" not appropriate.
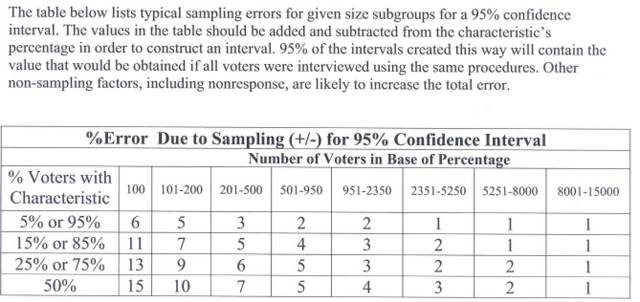
The CNN web-site reported a sample size of 13,047. The NEP national exit poll methods statementidicates that 250 precincts were sampled. This would yield anywhere from 50 to 52 interviews per precinct, which according to Mitofsky, translates into a design effect square root of 1.8, not 1.3. The added standard error only increases the approximate confidence interval a fraction of a percent (0.4%). However, the margin of error table circulated with the NEP data on election day for the national exit poll indicated that a sample size of 13,047 would have a +/-1% margin of error (Exhibit 3). Therefore, there is obviously a "range" of confidence intervals that could be associated with the data.
Using their caluclated +/-1.1% margin of error and Kerry's predicted 50.8% of the national vote, Simon and Baiman determine that if the poll were conducted 100 times, 95 of these 100 polls would show Kerry's proportion between 49.7% and 51.9%. Kerry's national vote tally indicated that Kerry received only 48.1% of the national vote and therefore the authors conclude that:
...assuming proper poll methodology, no discriminatory voter supression, and an accurate and honest popular vote count...the probability that Kerry would have received his reported popular vote total of 48.1%, or less is one in 959,000 - a virtual statistical impossibility (Simon and Baiman, 2004, p10).Using what I think I've demonstrated to be better data (e.g., +/- 1% with 51% for Kerry's predicted proportion) but the same methods, 95 out of 100 times, the exit poll would show Kerry's proportion between 50% and 52%. Again assuming an accurate vote count and no non-sampling survey error, and using the Simon/Baimon methods with these better data, the odds that Kerry would receive 48.1% of the popular vote is a whopping 151,606,801:1, not 959,000:1 as calculated by the authors.(1)
Consider, now, that the NEP exit poll data were rounded to a whole proportion.Kerry’s proportion was predicted to be 51%. However, Simon and Baiman compared this percent to an election result significant to a 10th. Therefore, when the 10th is considered, the true exit poll proportion could have been anywhere from 50.5% to 51.4%. We do not know where in this range the true 10th falls. Given this range of possible true exit poll proportions, the odds that Kerry would get 48.1% of the popular vote would range from 82,138:1 to 307,416,049:1 depending on the 10th associated with the exit poll data; again, not 959,000:1 as calculated by the authors.
Now let’s consider that the margin of error also has an error bound. According to Exhibit 3 above, the margin of error associated with an exit poll with 13,047 interviews is +/-1.0%. But Mitofsky said the more precise margin of error can be determined by calculating the average number of interviews per precinct and using the associated design effect square root.
Given that the average number of interviews per precinct was 50 to 52 (depending on whether you count the telephone interviews), the confidence interval for the national exit poll of 13,047 interviews was closer to +/-1.5%. With the range of possible confidence intervals associated with the data, compounded by the range associated with rounding of the exit poll data, the odds that Kerry's election result would equal 48.1% would be from 1,168:1 to 20,049,235,521:1 depending on rounding procedure and the precise design effect square root; again, not 959,000:1 as calculated by the authors.
But we’re not done.
The Simon/Baiman calculation assumes what is called a one-tail test. That means they are asking the following question: What are the odds that the election result would be 2.7% less than what the exit poll predicted for Kerry assuming a fair vote count and no non-sampling error? There are two serious problems with this question. First, the exit poll is subject to sampling error and we are assuming that the election tally is accurate and can therefore be considered an established standard. That means that if you took the exit poll 100 times, the average of the 100 exit polls (mean of samples), again assuming no bias of any sort, would equal the election result. These are the assumptions used by the authors.(2)
Simon and Baiman have it backwards as exhibited by their graphic labeled Figure 1 on page 13 of their paper. They apply the confidence interval to the exit poll, with the election result being the deviant. However, we know the "mean of samples," which in this case is the election result (again, as assumed by the authors, there is no bias/fraud in the election tally).
In circumstances where the mean of samples is known, statisticians apply the statistical test Z=(p-P)/s.e. to determine the magnitude (Z-score) and p-value of any discrepancy (where p=exit poll proportion; P=election result; and s.e.=standard error of the exit poll). The established standard becomes the mean of samples and the confidence interval is applied to the established standard. The poll result is then compared to the standard (Rea and Parker, 1997).
Second, the question should be a two-tailed question. Margin of error is by definition two-tailed (hence the +/-). In a situation where we know the mean of samples (the election result), the margin of error is applied to this mean. With a margin of error of +/-1.1%, assuming no bias in the survey, 95 of 100 exit polls would return a result ranging from 47.0% to 49.2% for the predicted Kerry proportion.
As we know the exit poll overstated Kerry’s proportion by 2.7%, but the odds are exactly the same that the same exit poll could have understated Kerry’s proportion by 2.7%. Therefore, the appropriate question is: What are the odds that the exit poll result would be +/-2.7%? To only look at the probability that the error could occur in one direction is violating the assumption that there is no bias in the exit poll or the election tally.
Considering the two-tailed question, the range associated with the exit poll proportion and the confidence interval, the odds that the exit poll result would be +/-2.7% would range from 584:1 to 10,024,617,760:1; again, not 959,000:1 as calculated by the authors. Exhibit 4 presents the p-values and probability calculations per the various methodologies and data assumptions described above.
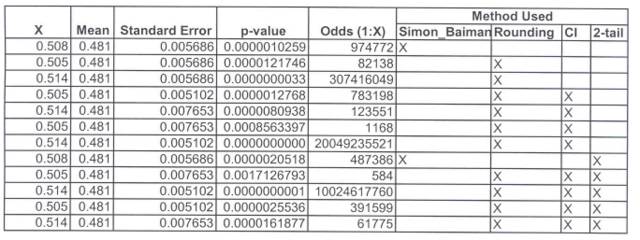
Because the data in the public realm are fuzzy, the data have an error-bound. Given this error bound, the odds that Kerry's exit poll result would be +/-2.7% deviant from the election result would range from 584:1 to 10,024,617,760:1.
Conclusion Based on Analysis of the Exit Poll Data
Given their statistical analysis of the exit poll data, Simon and Baiman concluded that:
The clear implication of our analysis is that neither random chance nor random error is responsible for the significant incongruence of exit poll and tabulated vote results, and that we must look either to significant failings in the exit poll design and/or administration or to equally significant failings in the accuracy and/or fairness of the voting process itself to explain the results (Simon and Baiman, 2004, p10).Although the implication is not “clear” from their analysis, I generally agree with the Simon and Baiman statement. They could also add that a combination of sampling error, non-sampling error, and vote fraud could account for the discrepancy. The point is that given the fuzziness of the data in the public realm, we simply cannot know for sure.
Clearly the national exit polls which predicted nearly the mirror of the election result were significantly variant from the election result. I don’t think anyone argues with this point; not even Warren Mitofsky or Joe Lenksi, the exit poll designers (see this Myster Pollster post with statements attributed to Mitofsky and Lenski).
If I’ve demonstrated anything with this post, it is that rigorous statistical analysis without consideration of the error bounds associated with the data and justification of the statistical methods employed, is highly dubious. Dr. Freeman of UPenn recently revised his paper with the title, “The Unexplained Exit Poll Discrepancy.” Dr. Freeman uses the same data source and essentially the same methodology as Simon and Baiman to analyze the discrepancy in Ohio, Florida, and Pennsylvania. He determines that the discrepancy in each state is statistically significan and reaches the following precise conclusion about this discrepancy:
Assuming independent state polls with no systematic bias, the odds against any two of these statistical anomalies occurring together are more than 5,000:1…The odds against all three occurring together are 662,000-to-one. As much as we can say in social science that something is impossible, it is impossible that the discrepancies between predicted and actual vote counts in the three critical battleground states of the 2004 election could have been due to chance random error.Statistically, the conclusion isn’t supportable. Given the fuzziness of the data being analyzed, I think it’s safe to say Freeman’s odds, like Simon and Baiman’s odds, have a large error bound. Again, I don't think anyone believes that the discrepancies can be explained by "chance random error."
So what is all this hub-bub about? Why write these papers using marginal statistical analysis and dubious logic “proving” there is a problem with the exit polls (or with the election result) when no one really disputes this fact? I suspect they went through this effort in an attempt to lend credibility to their analysis of "what went wrong." That is, they felt they had to come off as statisticians before they could speculate credibly as to what happened.
Everyone has a theory of what went wrong. Mitofsky and Lenski think the most likely culprit is a combination of sampling and non-sampling error (differential non-response). Freeman and Simon/Baiman think that Kerry really won the election. Dick Morris suspects that foul play on the part of the NEP. Everyone has a theory. Which is correct? I don't know. My point is that the data in the public realm are too fuzzy to determine statistically what went wrong with the exit polls.
Analysis of the Freeman paper forthcoming…
References
Agiesta, Jennifer. 2004. Electronic communication to Rick Brady, December 23.
Merkle, Dan. 2004. Electronic communication to Rick Brady, December 15.
Merkle, Dan. 2004a. Electronic communication to Rick Brady, December 17.
Mitofsky, Warren J. 1991. "A Short History of Exit Polls." Polling and Presidential Election Coverage. Eds. P. J. Lavrakas and J. K. Holley. Pp. 83–99. Newbury Park, CA: Sage.
Mitofksy, Warren J. 2004. Electronic communication to Rick Brady, December 7.
Mitofsky, Warren J. and Murray Edelman. 1995. "A Review of the 1992 VRS Exit Polls." Presidential Polls and the News Media. Eds. P. J. Lavrakas, M.W. Traugott, and P.V. Miller. Pp. 81-100. Boulder, CO: Westview Press.
Morin, Richard. 2004. Electronic communication to Rick Brady, December 30.
Rea, Louis M. and Richard A. Parker. 1997. Designing and Conducting Survey Research: A Comprehensive Guide.2nd Ed. San Francisco, CA: Jossey-Bass Publishers.
Simon, Jonathan D. and Ron P. Baimon. 2004. "The 2004 Presidential Election: Who Won The Popular Vote? An Examination of the Comparative Validity of Exit Poll and Vote Count Data." Published by Freepress.org.
----------------------------------------------------------------------
POST II: Simon and Baiman continued...
There's a nice write-up on the exit polls in Salon, which includes an interview of Mystery Pollster, Mark Blumenthal. Watch the ad and you can read the article for free. It's not perfectly accurate, but worth the read.
Speaking of not perfectly accurate, Simon and Baiman revised their paper, apparently in response to my criticism of their original paper. In a version updated on January 2, 2005, the authors maintain the three-legged strawman that is their literature review, and continue to violate their underlying assumptions by insisting on a single-tail test and setting the population mean to the exit poll result. However, they do attempt to deal with my challenges related to rounding and the confidence interval range.
Regarding the updates, the authors write:
Editor’s Note: The Dec. 28 document has been edited very slightly for greater clarity and accuracy without any substantive changes to its content.Right... we'll see.
Footnote #17 of their paper includes one of these revisions:
The totals for the full sample are computed by combining the candidate preferences of male and female respondents: Bush = [(males)46% x 52%] + [(females)54% x 45%] = 48.2%; Kerry = [(males)46% x 47%] + [(females)54% x 54%] = 50.8%. Alternatively, if Kerry's exit poll share is minimized by assuming minimal female and male shares and minimal Kerry vote shares out to four decimal places (as low as it can get subject to the indivisibility of whole voters), his absolute minimal vote share would be: 0.5345x0.5345+0.4545x0.4645 = 49.68%. In this case the reported actual Kerry vote of 48.1% is still far outside of the 95% confidence interval of + 1.1% and has just a one in 364 chance of occurrence (see analogous calculations for a Kerry exit poll result of 50.8% in text).As stated in this footnote, the exit poll data analyzed by Simon/Baiman were extrapolated from the gender splits reported by CNN.
I pointed out in my earlier post that, due to rounding, the true exit poll proportion for Kerry was anywhere from 50.5% to 51.4% and that it was impossible for them to derive a significant value of 50.8%. In the update, Simon/Baiman amazingly acknowledge the rounding issue affects the analysis by taking the decimal out to four places for each of the pointing out that the lower bound of Kerry's true exit poll data (non-extrapolated), when considering the lower bound partials of the male and female votes, the actual lower-bound of the Kerry proportion is 49.68%.
They are more precise in their rounding of the base gender proportions, but I only used 50.5% and 51.4% because I needed to compare it to data rounded to their 50.8%. Why didn't they take the partials out another decimal for the 50.8% in the first place?
Nevertheless, the exit poll data circulated to subscribing members on election day included data rounded to the whole point. Rounding of 49.75% cannot get you to 50.8% no matter how hard you try (therefore their "absolute minimal" values are lower than possible given the extrapolation to a whole which presumably yields 51%). Still, though, they manage to report that the odds due to their calculation of Kerry's "absolute minimal" exit poll share would be reduced from a whopping 959,000:1 to 364:1. If they would have used my methods, it would have been reduced from 959,000:1 to 82,138:1, but hey - I'll take their 364:1 - it will make my upcoming point clearer.
Skip now to the following statement from page 10 of their paper:
To carry our analysis further, we can employ a normal distribution curve (see Figure 1) to determine—again assuming proper poll methodology, no discriminatory voter suppression, and an accurate and honest popular vote count—that the probability that Kerry would have received his reported popular vote total of 48.1%, or less is one in 959,000—a virtual statistical impossibility.A couple of problems, here.
The graphic they refer to sets the exit poll as the true population proportion for Kerry, and the election result as the deviant value. This clearly violates their assumption that there was an accurate and honest popular vote count (voter suppression is irrelevant to this analysis because exit polls only poll those who voted). When you have an accurate vote count, you know the population parameter. The confidence interval of a poll is associated with the mean of samples, which means that if you take the same poll 100 times and then take the average of those 100 polls, you will get a mean. This mean has the confidence interval, not a single poll from the 100. The only time you apply the confidence interval to a single poll is when the true mean is not known. Assuming no bias or fraud, the true mean is statistically the same thing as the mean of samples. Therefore it is absolutely inappropriate to distort the facts and apply the confidence interval to the exit poll data given their assumptions.
But that is just me telling them that they are flagrantly biased and illogical in their presentation. The following criticism proves that they are downright misleading and perhaps dishonest in their presentation as well.
The thesis of their article is that "the probability that Kerry would have received his reported popular vote total of 48.1%, or less is one in 959,000—a virtual statistical impossibility."
Is there a footnote to this statement? Yes, but why did they not include what they revealed in Footnote #17? As the authors demonstrated, the probability value has an error bound. Because we cannot wave a wand and determine the value of Kerry's exit poll result to a digit significant to the 10th (or 100th in their revised footnote), every 10th within the range of possible 10ths has an equal probability of being the true exit poll proportion for Kerry. That means any probability within the calculated range has an equal chance of being the true probability of that the exit poll could be so deviant from the election result due to sampling error alone.
Okay, not done here. Another thing they seem to mess up in the same footnote:
Finally, if we change our cluster sampling adjustment to its maximal possible value of 1.8 (as reportedly stated by Mitofsky in a personal communication (see: http://stones-cry-out.blogspot.com/2005/01/simon-and-baimon-on-exit-polls.html) the Kerry actual reported vote of 48.1% still has only a one in 45 chance of occurring, i.e. well less than a 1% chance (0.0027 probability).Unfortunately the link to my post is not accurate, but that is my fault; I misspelled Dr. Baiman's last name in my original post and when I changed it, the URL changed. But let's consider the "non-substantive" changes here.
I have no idea how they get that the odds no change from 959,000:1 to 45:1? I didn't do this precise calculation, but when I considered even the lower-bound associated with the rounding of the data to a 10th and the 1.8 design effect square root, I didn't get anywhere near as low as 45:1. So again, they hurt their case, and even more so by failing to report this possibility in a revision of the paper or in a footnote to their thesis statement.
Does anyone think that the following statement would hold?
To carry our analysis further, we can employ a normal distribution curve to determine—again assuming proper poll methodology, no discriminatory voter suppression, and an accurate and honest popular vote count—that the probability that Kerry would have received his reported popular vote total of 48.1%, or less is 1 in 45 —a virtual statistical impossibility.Not in a heartbeat and they have to know it. If they would have stuck with my calculations, they could have footnoted their thesis statement as follows:
The calculated odds of 957,000:1 are based on an exit poll proportion for Kerry equal to 50.8%. However, because more precise data are not available for analysis, these calculated odds include an error bound, which ranges from 82,138:1 to 307,416,049:1.Now that is still pretty darn impossible if you ask me!
Why is this a problem? Because they are considered authorities by many and their pseudo-science can be convincing for the ignorant. Jonathan Simon has a J.D. and Ron Baiman has a Ph.D. and is affiliated with Institute of Government and Public Affairs University of Illinois at Chicago.
We all know the exit polls are significantly discrepant. What we do not know is exactly what happened. I've stated before, and I'll state it again: Given the data currently in the public domain, we do not know if the exit poll discrepancy can be explained by: 1) sampling error; 2) non-sampling error; 3) inaccurate vote count; or 4) any combination of 1-3.
To me their analysis tells me two things: 1) they do not understand some fundamentals of statistics; and 2) they realize that their analysis is weak (or bogus), but without it, they think that no one would buy the final three bullets of their paper, which are unsupportable by a fair analysis of the available data and literature.
The Simon/Baiman executive summary states:
- Evidence does not support hypotheses that the discrepancy was produced by problems with the exit poll.
- Widespread breakdown in the fairness of the voting process and accuracy of the vote count are the most likely explanations for the discrepancy.
- In an accurate count of a free and fair election, the strong likelihood is that Kerry would have been the winner of the popular vote.
If you believe the new media has any influence, then you have to conclude by a google of Jonathan Simon and Ron Baiman that these credentialed "analysts" are influencing people. REMEMBER - the left has a "tail" as well and they are using it.
Posted by Rick at March 20, 2005 07:21 PM
Trackback Pings
Listed below are links to weblogs that reference Critique of Simon/Baiman Exit Poll Paper:
» Critique of Simon/Baiman Exit Poll Paper from News from Around the World
Whether we like it or not: [Read More]
Tracked on March 31, 2005 04:31 PM
» Critique of Simon/Baiman Exit Poll Paper from News from Around the World
Whether we like it or not: [Read More]
Tracked on March 31, 2005 04:33 PM